The approved Special Report on the Ocean and Cryopshere in a Changing Climate from the IPCC (Intergovernmental Panel on Climate Change, the United Nations body for assessing the science related to climate change) provides new evidence that greenhouse gas emissions have far more consequences for the oceans than predicted. Sea level could reach around 60-110 cm by 2100 if no efforts are made. Even if greenhouse gas emissions are reduced and global warming is limited (below 2°C), water level will still rise 30 to 60 cm by the end of the century.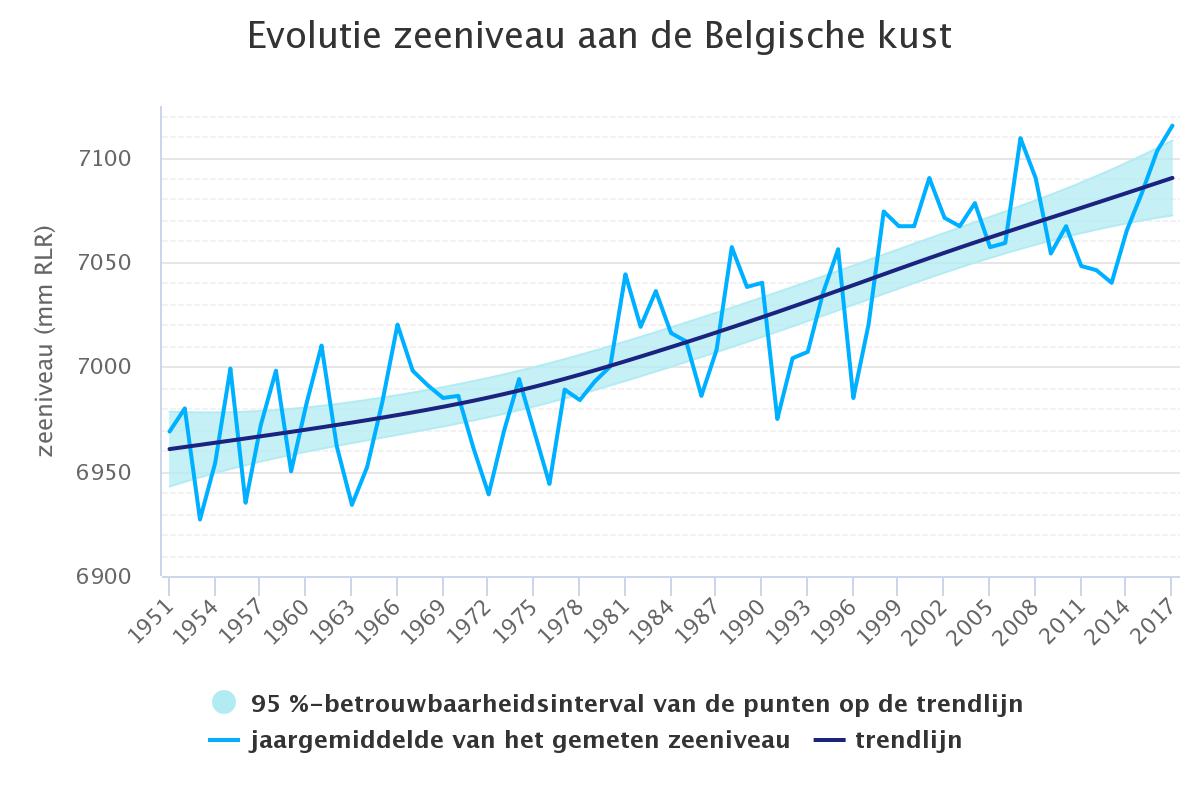
According the Belgian branch of the WWF (WWF-Belgium) the rising sea levels will also threaten the Belgian Coast: in the past fifty years, seawater has already risen by more than 10 cm. “With the rise of sea levels, the coastal ecosystem will be caught between increasing erosion on the seaside and urbanisation on the land side. Belgium must intensify its efforts to combat climate change and increase the coast’s resilience against the acceleration of rising sea-levels. We need to restore our natural coastal defence", said Sarah Vanden Eede, Oceans and Fisheries Policy Officer at WWF-Belgium.
The figure on the right shows the evolution of the annual average sea level on the Belgian Coast (1951-2017). It clearly shows that the annual average is considerably higher comparing with the start of the measurements (Source: MIRA op basis van PSMSL en Agentschap Maritieme Dienstverlening en Kust (WWW.MILIEURAPPORT.BE)). If you like to travel much further in time, you can watch a time-lapse video here that shows the evolution (9000 years ago - current situation) of the coastal zone based on historical maps that were georeferenced within the HisGISKust project.
Since 2011 a series of measures (Master Plan for Coastal Safety) have been taken to protect our 67 km long coast guaranteeing safety against flooding from the sea up to the year 2050 taking into account a sea level rise up to three meters by 2100. Hard (construction of storm walls, a wider dyke or storm surge barrier) as well as soft (beach nourishments) sea defences structures and techniques are being used. The final findings of the CREST project show that the beach nourishments on the Flemish coast provide solid protection against flooding. Despite the regularly occurring ‘cliffs’, the sand suppletions reinforce the beaches, as well as the sea dikes and dunes lying behind them.
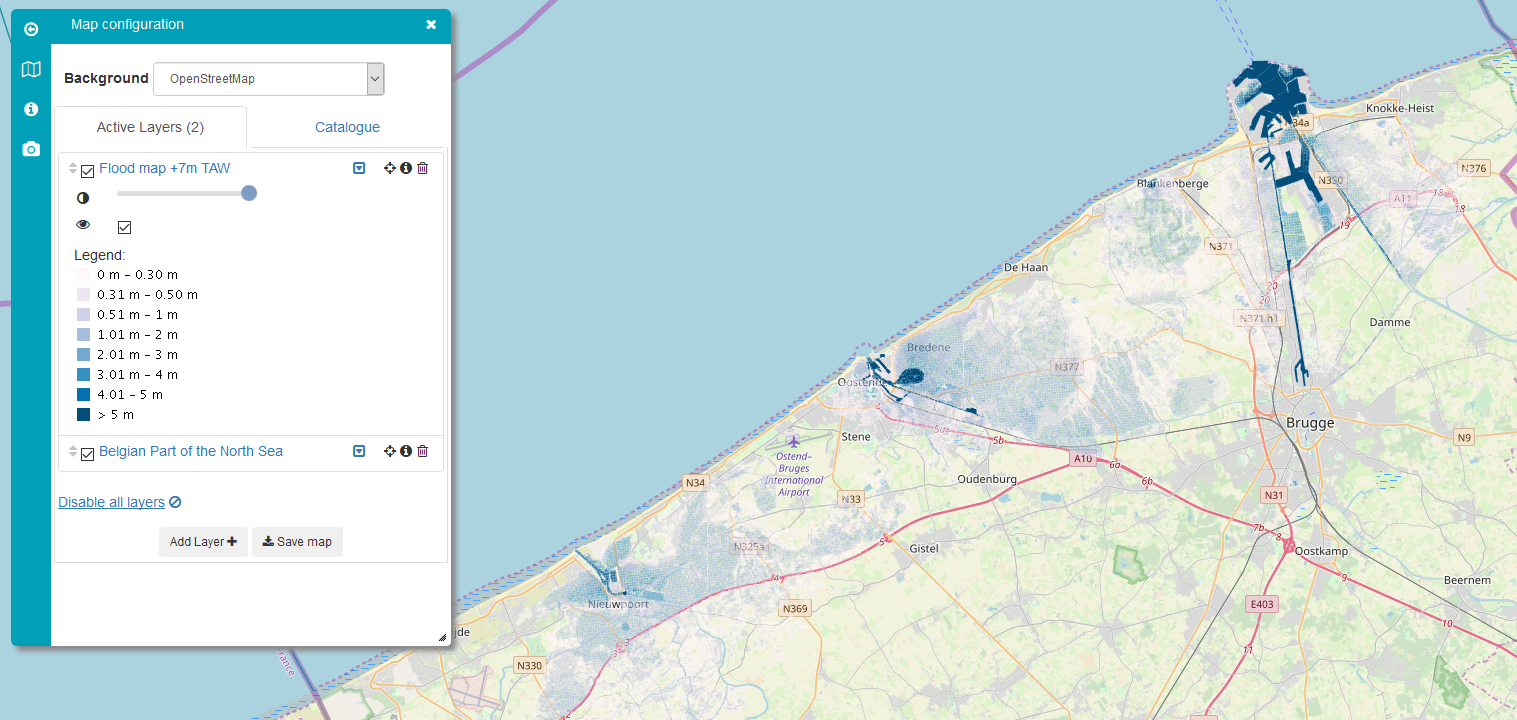
More information on coastal dynamics and defense can be found under the theme of Flood protection. Within the theme you can read more detailed information on Marine Spatial Planning, Flood risks, Sea defences and Coastline evolution. The test zone defined in the Marine Spatial Plan for testing new methods of sea defenses is available as a static and dynamic map. Within the Flood risks section you can also find the dynamic map (see below) of the potential floodable surface and the associated water depth when a 1,000-year storm surge occurs on the coast, calculated with the seawall in the year 2015 (Source: MOW-MDK, Coastal Division). In addition, via the Klimaatportaal Vlaanderen, you can also consult the dynamic map on the theme of sea level rise that shows the number and type of vulnerable institutions at risk when a 1000-year flood occurs (Source: VMM).